
Large, multisensor datasets are available covering a large portion of Mars. Analysis and display of these datasets are currently in use for path planning tools that provide a precise, low-level visualization that fosters precision planning for Rover Planners at NASA Jet Propulsion Laboratory. However, these visualizations do not foster path planning at a higher level of abstraction. In addition, planning a path uses a non-intuitive process of generating rover commands, simulating them, visualizing the results, and then tweaking the commands until the path looks correct.
RSketch expedites path planning for JPL Rover Planners by allowing them to intuitively generate and assess rover paths. The path generation process in RSketch must be influenced by traversability measures, incorporate and visualize multisensor data used for the traversability analysis, enable rapid path generation and comparison between alternatives, and export generated paths to mission operations tools.
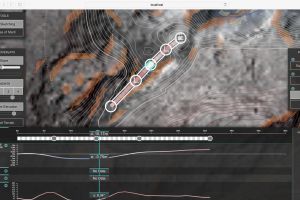
The prototyped RSketch system aims to provide a streamlined path generation and analysis tool for Rover Planners. The tool uses processed data, raster images, and rover state files as the basic dataset. RSketch uses this dataset to provide the Rover Planner with situational awareness of the rover's state and the surrounding environment in a 2-dimensional map space. The Rover Planner can select and modify the display of the overlaid data on the map, as well as view annotations such as the long-term path.
In order to plan out a path, RSketch provides Rover Planners a simple sketching capability to drop and modify waypoints that define a driving path. These waypoints can later be imported into the rest of the Rover Planner's system as localized waypoints - other parts of the Rover Planner system then generate low-level rover commands from the exported path in RSketch. This export feature allows Rover Planners the ability to integrate with the rest of their system.
When sketching out a path, Rover Planners are able to visualize data along the entirety of the rover path. The data is visualized in two different forms: directly on the path and along a slideout panel. Both of these visual forms afford varying analysis modalities. The data along the path, coupled with path sketching affords the ability to make informed decisions on how a modification affects the rover's planned traversal. The slide-out graphs allow Rover Planners to conduct summative analysis at different chronological points of the path planning process by visualizing all data parameters at once.
At the Information Interfaces Lab, computing technologies are developed that help people take advantage of information to enrich their lives. The lab group develops ways to help people understand information via user interface design, information visualization, peripheral awareness techniques and embodied agents. The goal is to help people make better judgments by learning from all the information available to them.
