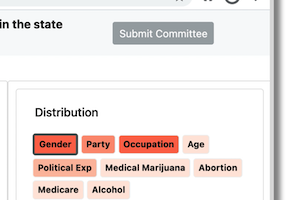
Human biases impact the way people analyze data and make decisions. Recent work has shown that some visualization designs can better support cognitive processes and mitigate cognitive biases (i.e., errors that occur due to the use of mental "shortcuts"). In this work, we explore how visualizing a user's interaction history (i.e., which data points a user has interacted with) can be used to mitigate potential biases that drive decision making by promoting conscious reflection of one's analysis process. Given an interactive scatterplot-based visualization tool, we showed interaction history in real-time while exploring data (e.g., by coloring points in the scatterplot that the user has interacted with), and in a summative format after a decision has been made (e.g., by comparing the distribution of user interactions to the underlying distribution of the data). We conducted a series of in-lab experiments and a crowdsourced experiment to evaluate the effectiveness of interaction history interventions toward mitigating bias. We contextualized this work in a political scenario in which participants were instructed to choose a committee of 10 fictitious politicians to review a recent bill passed in the U.S. state of Georgia banning abortion after 6 weeks, where e.g. gender bias or political party bias may drive one's analysis process. We demonstrate the generalizability of this approach by evaluating a second decision making scenario related to movies. Our results are inconclusive for the effectiveness of interaction history (henceforth referred to as interaction traces) toward mitigating biased decision making. However, we find some mixed support that interaction traces, particularly in a summative format, can increase awareness of potential unconscious biases.